
Sunday, June 21, 2009
Economy trends
Economic growth
In our economic history there are some things that are not fully understood. The most significant is probably the economic cycle. The are many reasons an economic downturn can happen, war, oil crisis, terrorist attacks, mortgage crisis, etc… And as unpredictable these may be they end up contributing to the cycles.
The economic cycle is relatively easy to predict and can give a rough estimate on how the next few years will be like. Knowing our economic cycle can give us a broad perception of the future and allow us to plan accordingly.
US GDP Growth yearly, 5yr average and 5yr trend

USA GDP growth, yearly change in blue/orange (quarterly), 5 year average in red (first 5 year are average until 1948, quarterly), arithmetic trend line in black.
In the above chart there are a few things we can see
- The economy is becoming more stable as time progresses
- This is mostly because the government has a better understanding of macroeconomics than ever before, so it adjusts the economic policies to that effect. So we get less recession periods and in the same token we also get more modest growth periods.
- This is mostly because the government has a better understanding of macroeconomics than ever before, so it adjusts the economic policies to that effect. So we get less recession periods and in the same token we also get more modest growth periods.
- The average growth changed very little
- As we can see in the red line, the average growth is almost the same as it was in 1948 with a very slight decreasing tendency.
- As we can see in the red line, the average growth is almost the same as it was in 1948 with a very slight decreasing tendency.
- Recession cycles are preceded by strong growth cycles
- There is also some correlation between the strength of the recession and the strength to the growth
- There are longer cycles averaging 10 years and smaller cycles averaging 2 years
- A recession usually constitutes of a lower turn in the longer and the shorter cycles.
- A recession usually constitutes of a lower turn in the longer and the shorter cycles.
- The 5 years average is always above 1.5% growth
Average 5 years
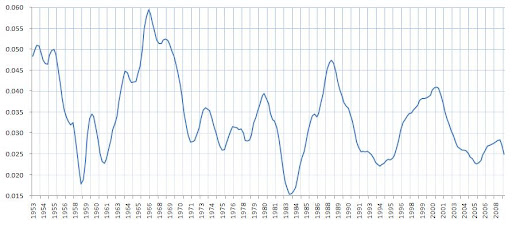
Average 5 years.
This is a closer view to the 5 years average. The 55 years average growth is 3.44%.
In this view it is easier to see the cycles, however a 5 year average also limits the reaction time, this is, after the economy recover from a bad cycle it will take about 3 years for this graph to show.
Very roughly we can see
- 50's poor economic cycle
- 60's good cycle
- 70's to mid 80's poor cycle
- Late 80'd good cycle
- Beginning 90's poor cycle
- Mid 90's to beginning of 2000's good cycle
- Late 2000's poor cycle
Because it is an average of 5 years, means that the above numbers can vary up to 5 years from the actual recovery or down turn.
The economic cycles can vary from 5 to 15 years. A poor cycle is proceeded by a good cycle and vice-versa.
US GDP growth compared to the unemployment rate

USA GDP growth, 1 year change in blue, unemployment rate in red
There is a strong correlation between the economic growth and the unemployment rate, no surprise here. We can also see how the unemployment can rise very quickly however it only falls through a long period of time.
What qualifies a crisis into a depression is the unemployment rate.
Effects
Economic policies
The government adopts several policies according to the economic output of the country. When the economic growth is high, the interest rates will rise too, when the economic growth is small or negative the interest rates will fall.
Besides changing the interest rates the government can also increases public spending, usually meaning more government contract for private companies.
Prices
Prices are determined by the supply and demand. When the economic output is low the demands will also be low (the demand (private consumption) goes directly in the GDP calculation) so one way companies try to increase demand again is by lowering their prices, this results in low inflation levels, sometimes even negative value.
Stock market
The stock market is a great indicator of how well a country is performing economically, a below average rise or even a fall in the stock prices can be expected.
Money
The money value is also determined by supply and demand (although it can vary from country to country). The money value falls when demand is low and rises when demand is high.
The government can also affect directly the value of the money either by issuing more notes and coins or by changing the interest rates.
The government usually emits more money in economic downturn, as a way to decrease the value of the money and therefore increase the exportation levels and lowers importation.
Employment
When things turn bad companies start cutting their costs, this includes firing employees.
A.R.
Subscribe to:
Post Comments (Atom)


No comments:
Post a Comment